
 Green Bonds' Growing Role in ESG Investing
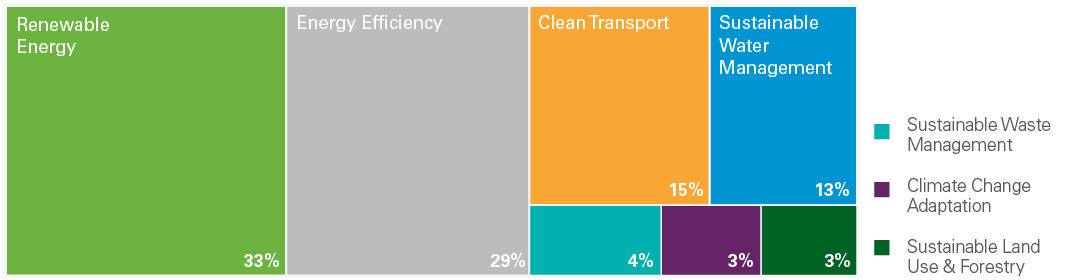
Source: Lazard Asset Management Summary Green bonds are an important component of ESG investing. They align investors with environmentally friendly projects and provide crucial social benefits. Demand for green bonds is surging. Green bond issuance has steadily increased since 2007 and is expected to surpass $250 billion in 2018. As the global economy shifts to a low-carbon footprint, portfolios that have proactively reduced their carbon exposure may be better positioned to outperform the broad market. We believe integrating ESG factors and green bonds into a portfolio may lead to better returns. The focus on responsible investing has grown rapidly over the past decade, and it is now considered mainstream in many parts of the world to incorporate environmental, social, and governance (ESG) factors into investment analysis. Since the Principles for Responsible Investing (PRI) initiative was launched in 2006 with support from the United Nations, more than 1,800 signatories, nearly 400 of which manage roughly $70 trillion of assets, have joined this effort (Exhibit 1). There is also increased awareness of the UN Sustainable Development Goals (SDGs) which cover a broad range of economic and social development issues. Here, we describe green bonds and their underlying principles, and explain the market for these securities as well as their issuance. The Principles for Responsible Investing (PRI) is the world’s leading proponent of responsible investment. Asset owners and investment manager signatories are required to report on their responsible investment activities annually through the PRI Reporting Framework. Source: PRI Why Green Bonds? A green bond is a standard fixed income instrument whose proceeds are used to finance "green” or environmentally friendly projects. This type of investment is compatible with an ESG framework (especially the environmental and social factors). In the past, investors have tended to focus more specifically on governance factors to better understand the risks and opportunities associated with lending to different entities. Today, however, instruments like green bonds are allowing investors to directly address the environmental and social aspects of their investments. Proceeds from green bonds issued to finance solar or wind projects, for instance, may also provide clean water, lessen pollution, and introduce a sustainable energy source to remote areas. From an investment perspective, green bonds provide an ESG-friendly option for investors wanting to navigate the transition away from fossil fuel investments and reduce exposure to "stranded assets,” such as coal companies. Momentum for green bonds has strengthened as various global institutions and organizations increasingly divest their portfolios away from fossil fuel investments as they focus on mitigating or addressing climate change. This trend should help support strong valuations for green bonds. Issuance is also increasing as the "labeled” (bonds that are certified as green) and "unlabeled” (projects that are linked to environmental benefits but are not certified green) markets evolve. We believe that countries and companies that can reduce carbon emissions and adapt to, or mitigate climate change will be better positioned to prosper. Green bonds are particularly important to the clean energy, infrastructure, and transportation industries as they allow countries and companies to obtain funding to achieve positive and sustainable environmental and social goals. Clean Energy Climate change is a potential disruptive factor for asset valuations. In 2015, the United Nations Climate Change Conference (COP 21) convened with the goal of securing global commitments to reduce greenhouse gas emissions in order to limit the increase in global temperatures to 2 degrees Celsius. Today, 195 countries have signed on to this initiative and many cities and companies have adopted their own targets for reduced emissions. We believe the energy revolution will not only provide positive environmental benefits, but will also have a significant effect on the investment landscape. In recent years, investment in wind, solar, and other renewable energy technologies has grown fast, and we expect this momentum to continue (Exhibit 2), particularly in Europe, China, and India. Even in the United States, renewable energy represents over 15% of power generation. Green bonds are a vehicle for financing sustainable infrastructure projects, which are increasing in number. The cost of developing needed global infrastructure by 2025 is estimated to be at least $78 trillion. These projects range from building new transportation facilities and energy efficient buildings to enabling sustainable water management and sustainable agriculture. Green bonds lend themselves well to public-private partnerships where private sector efficiencies are combined with public sector governance. These investment collaborations tend to be relatively more stable as both parties have aligned interests. With global monetary policy largely exhausted in many countries, green bonds could help support infrastructure spending. This could provide much-needed fiscal stimulus for local and global growth, while also helping to achieve environmental and social goals. Electric Vehicles Gasoline-powered vehicles, or internal combustion engine vehicles, account for a meaningful part of global oil consumption. Meanwhile, the growth of the global electric vehicle (EV) market is expected to reduce demand for fossil fuels and a growing number of countries are considering banning the sale of new gasoline-powered vehicles (Exhibit 3). Norway, a large petroleum-producing country, was an early proponent of this trend and currently boasts EV penetration close to 50%, which is in line with its goal to ban new sales of internal combustion engine vehicles by 2025. Green bonds are a great way to participate in "disruptive technologies” within the transportation/EV sector. Proceeds from some of these bonds have been used to support development of car batteries and charging station infrastructure. Toyota and Geely (which manufactures taxis used in London) have both issued green bonds to help finance EV research and manufacturing. Green Bond Issuance and Use of Proceeds Green bond issuance has steadily increased since 2007, when the European Investment Bank issued the first "Climate Awareness Bond.” Total issuance surpassed expectations in 2017 and is expected to exceed $250 billion in 2018 (Exhibit 4). Citigroup estimates that green bonds could grow into a trillion dollar conduit for climate-related investments by 2020 and SEB, a Swedish bank, predicts that 20% of all bond issuance may be "green” within a few years. Banks and corporations in the developed world are expected to issue more green bonds. There should also be active issuance by sovereigns and municipalities and we expect a greater number of green securitized bonds. In the emerging markets, Chinese companies had significant green bond issuance in 2016 and other countries, such as India, Kenya, and Fiji, have started to issue green bonds. While green bond proceeds have been put to use in many ways, in the past they have primarily been channeled to renewable energy and energy efficiency projects (Exhibit 5). Efforts to develop low-carbon transportation and sustainable water and waste management are increasing and green bonds are becoming a more commonplace form of financing for urban metro and rail projects. Export Development Canada (EDC) and Kommuninvest are two organizations that are heavily committed to supporting "green” projects. Financial institutions, such as Barclays, have also issued green bonds. As added incentive, the European Commission is considering lower capital requirements for bank lending to select "environmentally friendly” projects. Green Bond Principles and Governance Rules continue to emerge to govern the nascent green bond sector. The Green Bond Principles (GBP) are currently the most well-established framework for evaluating these instruments. The GBP were developed by the International Capital Markets Association and have four components: use of proceeds, process for project evaluation, management of proceeds, and project reporting. These are voluntary guidelines and the determination of what constitutes a green bond is still left to the issuers and underwriters. Many issuers choose to secure an independent review and to this end a Climate Bond Certification is generally recommended. Examples of organizations who conduct this independent verification include Sustainalytics, Cicero, DNV GL, and accounting firms such as Ernst & Young and Deloitte. Moody’s was one of the early entrants to the green bond "second opinions” market in 2016, and constructed a methodology to assess the environmental credentials of issuers. Its framework evaluates the issuer’s approach to managing, administering, allocating, and reporting on the projects financed by green bonds, and produces a composite grade ranging from "Excellent” (GB1) to "Poor” (GB5). The use of proceeds carries the largest weighting (40%) in their score. S&P also launched a Green Evaluation Tool to score green projects according to the quality of governance, transparency of a transaction, and the environmental impact associated with the project. As investors continue to integrate sustainability into their investment process, we expect that green bond standards and classifications will continue to develop in scope and detail. Green Bond Investment Opportunities The Bloomberg Barclays MSCI Global Green Bond Index draws heavily from the GBP and has a stated aim to offer investors an objective, robust measure of the green bond market. The index’s characteristics have evolved over the past few years, but agency and supranational issuers still dominate, accounting for almost half of all green bond issuance. Sovereign issuers were very active in 2017, and France now has the biggest single green bond outstanding at €9.7 billion. US mortgage lending agency Fannie Mae topped the charts with over $27 billion of green mortgage-backed securities issuance aimed at funding a multifamily green initiative program. Corporations representing industries ranging from financials to utilities to industrials are also increasing their market share. Municipal issuers are participating, but some of these issue sizes are small, and as such they may not be accessible to institutional investors. The index’s currency breakdown is largely euro- and US dollar–denominated, along with roughly 10%–15% represented by Canadian dollars, British pounds and others. This index also excludes high yield securities as well as Chinese renminbi–denominated green bonds. Ultimately, we believe that an active and tactical approach to investing in green bonds may allow investors to better manage risk factors, such as those relating to currencies and rates. In addition, the index only includes "labeled” green bonds, and there may be additional opportunities in bonds not labeled "green” whose proceeds are applied toward advancing positive environmental and social causes. An example of an attractive relative value opportunity can be seen in Mexico’s first green bond issuance, initiated by Nacional Financiera (NAFIN), a development bank, whose proceeds are being used exclusively to fund and invest in wind projects (Exhibit 6). Not only is NAFIN supported by an explicit guarantee from the Mexican government, but the bond was also issued at an attractive spread over Mexican government bonds. The issuer obtained an independent review from Sustainalytics, is Climate Bond Certified, and received the "Green Bond of the Year” award for 2015. Mention of these securities should not be considered a recommendation or solicitation to purchase or sell the securities. It should not be assumed that any investment in these securities was, or will prove to be, profitable, or that the investment decisions we make in the future will be profitable or equal to the investment performance of securities referenced herein. There is no assurance that any securities referenced herein are currently held in the portfolio or that securities sold have not been repurchased. The securities mentioned may not represent the entire portfolio. Source: Lazard, Bloomberg An Important Element of ESG Investing The green bond market is rapidly growing and evolving, but it is still in the early stages of development. A key driver of its momentum is the increasing engagement with ESG factors and sustainable investing on the part of issuers and investors. Green bonds offer governments and companies a way to capitalize on this trend. As society focuses on reducing its carbon footprint, we believe portfolios that recognize this secular trend and proactively reduce their carbon exposure may be better positioned to outperform the broad market. We believe an investment approach that emphasizes sustainability is better placed to add value in the long run. Based on our observations as managers of global fixed income portfolios, the integration of ESG factors and green bonds into the investment process can help investors reap opportunistic gains as well as defend returns.
0 Comments
 Global energy demand grew by 2.1% in 2017, and carbon emissions rose for the first time since 2014
Report: Global Energy and CO2 Status Report - Oil demand grew by 1.6%, more than twice the average annual rate seen over the past decade, driven by the transport sector (in particular a growing share of SUVs and trucks in major economies) as well as rising petrochemical demand. - Natural gas consumption grew 3%, the most of all fossil fuels, with China alone accounting for nearly a third of this growth, and the buildings and industry sectors contributing to 80% of the increase in global demand. - Coal demand rose about 1%, reversing declines over the previous two years, driven by an increase in coal-fired electricity generation mostly in Asia. - Renewables had the highest growth rate of any fuel, meeting a quarter of world energy demand growth, as renewables-based electricity generation rose 6.3%, driven by expansion of wind, solar and hydropower. - Electricity generation increased by 3.1%, significantly faster than overall energy demand, and India and China together accounting for 70% of the global increase. - Energy efficiency improvements slowed significantly, with global energy intensity improving by only 1.7% in 2017 compared with 2.3% on average over the last three years, caused by an apparent slowdown in efficiency policy coverage and stringency and lower energy prices. - Fossil fuels accounted for 81% of total energy demand in 2017, a level that has remained stable for more than three decades.  Carbon capture and storage (CCS): the way forward
Carbon capture and storage (CCS) is broadly recognised as having the potential to play a key role in meeting climate change targets, delivering low carbon heat and power, decarbonising industry and, more recently, its ability to facilitate the net removal of CO2 from the atmosphere. However, despite this broad consensus and its technical maturity, CCS has not yet been deployed on a scale commensurate with the ambitions articulated a decade ago. Thus, in this paper we review the current state-of-the-art of CO2 capture, transport, utilisation and storage from a multi-scale perspective, moving from the global to molecular scales. In light of the COP21 commitments to limit warming to less than 2 °C, we extend the remit of this study to include the key negative emissions technologies (NETs) of bioenergy with CCS (BECCS), and direct air capture (DAC). Cognisant of the non-technical barriers to deploying CCS, we reflect on recent experience from the UK's CCS commercialisation programme and consider the commercial and political barriers to the large-scale deployment of CCS. In all areas, we focus on identifying and clearly articulating the key research challenges that could usefully be addressed in the coming decade. Broader context Carbon capture and storage (CCS) is recognised as being vital to least cost pathways for climate change mitigation, and in particular the negative emissions technologies (NETs) that are key to limiting warming to “well below” 2C. However, it has not yet been deployed on the scale understood to be required, owing to a variety of technical, economic and commercial challenges. This paper provides a state-of-the-art update of each of these areas, and provides a perspective on how to the discipline forward, highlighting key research challenges that should be addressed over the course of the next decade. Importantly, this perspective balances scientific, policy and commercial priorities. 1 Introduction This paper is the third installment in a series of publications over several years in Energy & Environmental Science.1,2 The first (published in 2010) provided an introduction to CO2 capture technologies, with an overview of solvent-based chemisorption (amines and ionic liquids), carbonate looping, oxy-fuel combustion technologies, CO2 conversion and utilisation (CCU) and multi-scale process engineering of CCS.1 The second installment presented an update on developments in amine scrubbing, ionic liquids, oxy-combustion and calcium looping. New topics added in this second paper include chemical looping combustion, low temperature adsorbents, direct air capture technologies, flexible CCS operation, CO2 transport and storage, and a historical overview of the UK and EU CCS policy and legislation.2 Distinct from the previous installments, this third paper sets out to comprehensively review the state-of-the-art developments in CCS, whilst also providing a holistic perspective on the role of CCS technologies in mitigating anthropogenic climate change. We first discuss the current status of CCS development and highlight key CCS technologies that are near commercialisation phase (Section 2). Then in Section 3 we contextualise CCS technology by considering its representation and utilisation in integrated assessment models (IAMs), challenging the view that it is a “bridging technology”, likely to be relevant for only a few decades. We then go on to quantify and qualify the role and value of CCS at a more granular level by evaluating the way in which CCS interacts with national scale electricity systems. This in turn helps us address the question of what service CCS provides to the electricity system, with whom is CCS competing and what technologies does CCS complement. We then move on to consider the utility of CCS in decarbonising the industrial sector, with a focus on the key emitters – the production of iron and steel, cement and oil refining and petrochemicals. Throughout, we aim to challenge the perception that industrial CCS is uniquely costly, showing that, for example, the cost of decarbonising the refining sector is essentially “lost in the noise” of market fluctuations of the end use sectors. Section 4 of the paper considers key post-combustion CCS technologies in detail. The purpose of this paper is not to enumerate the panoply of technologies that are available for capturing CO2. Rather, we focus on solid- and liquid-phase sorbents, and attempt to specify key research questions that need to be address in these areas. We then select three particularly promising alternative technologies for CCS in Section 5: chemical looping combustion, membranes and ionic liquids. It is well known that the thermophysical and kinetic properties of the sorbents used for CO2 capture dictate both the capital and operating cost of the processes in which they are used. For this reason, there is a concerted effort to rationally design new sorbent materials, with the bulk of the effort in the development of liquid sorbents, where available theories are more readily applied. Thus, we present an assessment of SAFT-based approaches to model and design new materials in Section 6, with a focus on how efforts at the molecular and process scales might be linked. Before CO2 can be safely and reliably sequestered, it must be transported from source to sink. Whilst the majority of studies assume pipeline transport, ship and rail transport are potential alternatives; these other transport options are discussed in Section 7. Similarly, despite the fact that CO2 transport by pipeline is exceptionally mature, the impact of capturing CO2 from a diverse set of power and industrial sources on the quality of CO2 being transported is sufficiently important to warrant careful consideration. The typical fate of CO2 is to be sequestered, either in a saline aquifer or, potentially, used for enhanced oil recovery (EOR). The various challenges of operation, monitoring and verification of CO2 storage are discussed in Section 8, whereas Section 9 discusses CO2-EOR. A potential alternative to the storage of CO2 is its re-use – the valorisation of CO2 to produce marketable compounds. The argument is sometimes made that this can both contribute to climate change mitigation and provide an attractive revenue stream. Section 10 discusses the potential for CO2 conversion and utilisation (CCU), also its merits and challenges are presented and considered. In light of the global commitment achieved in Paris in December, 2015,3 we have extended this paper to include key negative emissions technologies (Section 12); bioenergy with CCS (BECCS) and direct air capture of CO2 (DAC). These areas are of particular importance owing to their potential importance and their controversy. Despite the fact that there are currently 37 CCS projects at various stages in the Americas, Europe, Middle East and Asia-Pacific,4 CCS continues to languish as an “orphan technology”.† With decades of technical experience across the entire value chain, it is clear that it is not a lack of technical expertise that is inhibiting the commercial deployment of CCS technology. Thus, we have devoted a section of this paper to consider “what needs to happen” from a commercial perspective (Section 13), drawing upon experience developed as part of the UK's most recent CCS commercialisation programme.5 Having provided this perspective from the private sector, we then complement this with an international analysis of the political economy of CCS (Section 14). Section 15 then concludes with a proposed approach to evaluate the utility of a “novel technology” and feasibility of particular targets by identifying limitations that might prove to be showstoppers. 2 Current status of CCS development Carbon capture and storage is expected to play an important role in meeting the global warming targets set by the IPCC6 and at COP21.3 There is a suite of technologies being developed for the capture, transport, storage and utilisation of CO2. Typically, technology development will progress in a series of scale-up steps: (i) bench or laboratory scale, (ii) pilot-scale, (iii) demonstration scale, and lastly (iv) commercial scale.7Fig. 1 summarises the current development progress of different CCS technologies on the TRL scale.‡ As illustrated by Fig. 1, there is congestion of technologies at the TRL 3, TRL 6 and TRL 7 development phases. The progression of a technology beyond TRL 3 requires further research funding, whereas advancing technologies beyond TRL 5 and TRL 7 needs significant financial investment and/or commercial interest (e.g., in the case of polymeric membranes). Further detailed discussion on the technical development of the individual CCS technologies is presented in the following sections of this paper. Here in this section, we highlight the key CCS technologies that have reached (or close to reaching) the commercial phase of development. Current development progress of carbon capture, storage and utilisation technologies in terms of technology readiness level (TRL). BECCS = bioenergy with CCS, IGCC = integrated gasification combined cycle, EGR = enhanced gas recovery, EOR = enhanced oil recovery, NG = natural gas. Note: CO2 utilisation (non-EOR) reflects a wide range of technologies, most of which have been demonstrated conceptually at the lab scale. The list of technologies is not intended to be exhaustive. CO2 capture Chemical absorption (e.g., using aqueous amine solutions) has been used to remove CO2 from natural gas for decades,11 thus, it is considered to have a TRL of 9. This technology has been utilised in two commercial-scale post-combustion capture facilities in coal-fired power plants, Boundary Dam12,13 and Petra Nova.14,15 Recent developments in polymeric membranes have enabled the technology to successfully achieve demonstration scale (TRL 7). The Polaris membrane is now available commercially and has been used for CO2 separation from syngas.16 Air Products are licensing a polymeric membrane developed at NTNU, which can be applied to coal-fired power plants and other combustion processes (still under development).17 Thus, The first “commercial-ready” direct air capture (DAC) plant recently opened in Hinwil, Switzerland on May 2017,18 with the support of cost contributions from the Swiss Federal Office of Energy. The plant supplies 900 tonnes of CO2 annually to a nearby greenhouse.19 Capture technologies that have also reached TRL 7 (demonstration) (e.g., oxy-combustion coal power plants, adsorption) could also potentially reached commercial status in the near future. In contrast to post-combustion capture, integrated gasification combined cycle (IGCC) with CCS has been less successful with the Kemper County IGCC Project being suspended recently.20 Southern Company's decision to halt the project came after encountering a series of problems, these include failure to meet the delivery deadline, severe technical issues and being majorly over budget.21,22 CO2 transport The technologies for CO2 transport are well established. There are >6500 km of CO2 pipelines worldwide (both on-shore and off-shore), most of which are associated with EOR operation in the United States.23 The technology for CO2 transport with ships is also relatively mature.24 As these transport technologies are currently being used in commercial applications, all have a TRL of 9. CO2 storage As many commercial-scale CCS projects already use CO2-enhanced oil recovery (EOR), 13 of the 17 operating commercial-scale CCS projects, there is a significant amount of existing experience and knowledge, which has enabled CO2-EOR to reach TRL 9. Similarly, saline formations have been used for CO2 storage at commercial-scale project, including Sleipner CO2 Storage, Snøhvit CO2 Storage and Quest (on-shore and off-shore). In contrast, CO2 storage by enhanced gas recovery (EGR)25 and storage in depleted oil and gas fields have not reached operation at commercial-scale, thus, both are still at the demonstration phase (TRL 7). Ocean storage and mineral storage are still in the early phases of development. CO2 utilisation There are a number of facilities that utilise CO2 for various applications. These commercial CO2 utilisation processes are TRL 9 as they are mature technologies. Most are in the food and beverage industry and some in chemical production (e.g., urea, methanol).26 Several projects utilise CO2 for mineral carbonation, for example, Searles Valley plant (US). In Saga City, Japan, CO2 capture from waste incineration is utilised for the cultivation of crops and algae.27 The CO2 for each project is mainly sourced from industrial processes (e.g., fertiliser production, ammonia production, ethylene glycol plants), but some projects capture the CO2 from power plant flue gas.26 Commercial-scale CCS projects Deployment of large scale CCS projects has been slow. Of the 37 major large scale CCS projects, 17 of these are in operation, 4 in construction and the remainder are in varying stages of development.4 As shown in Fig. 2 and 3, the majority of the commercial large-scale CCS projects are located in the United States. In terms of the project life cycle (i.e., identify, evaluate, define, execute and operate), the US also has the greatest proportion of projects in operation. For all but one of these projects, enhanced oil recovery is the primary storage for the captured CO2. Furthermore, the projects in the US have the largest CO2 capture capacity compared with projects in the rest of the world: Century Plant captures 8.4 MtCO2 per year, whereas Shute Creek Gas Processing Facility capture 7 MtCO2 per year.4 image file: c7ee02342a-f2.tif Fig. 2 The CO2 capture capacity of commercial-scale CCS projects worldwide. The number labelled on each proportion of capture capacity corresponds to the number of projects. Data from the Global CCS Institute.4 Commercial-scale integrated CCS projects around the world. Circle size is proportional to the CO2 capture capacity of the project and the colour indicates the lifecycle of the project. Data from the Global CCS Institute.4 Although China has the second highest number of projects, only one of these is in the execute phase (Yanchang Integrated CCS Demonstration), and most are in early stages of development (e.g., pre-feasibility, FEED studies). The CO2 capture capacity of the projects in China range between 0.4–2 MtCO2 per year. Europe has the third highest number of large-scale projects, with two operational projects in Norway: the Sleipner CO2 Storage Project captures 1 MtCO2 per year, and Snøhvit CO2 Storage Project 0.7 MtCO2 per year. Of the five projects in Canada, three are in operation: (i) Great Plains Synfuel Plant and Weyburn-Midale Project (3 MtCO2 per year), (ii) Boundary Dam CCS Project (1 MtCO2 per year), and (iii) Quest (∼1 MtCO2 per year). There are also operating CCS projects in Brazil, Saudi Arabia and United Arab Emirates with CO2 capture capacities ranging from 0.8–1 MtCO2 per year. A fundamental requirement for the success of CCS projects in all of these projects is the availability of safe geological storage for the capture CO2. Furthermore, other factors that can help bring CCS projects into operation phase include secure financial funding, as well as supportive policy and legislative frameworks.  Electricity storage and renewables: Costs and markets to 2030
Battery electricity storage is a key technology in the world’s transition to a sustainable energy system. Battery systems can support a wide range of services needed for the transition, from providing frequency response, reserve capacity, black-start capability and other grid services, to storing power in electric vehicles, upgrading mini-grids and supporting “self-consumption” of rooftop solar power. In the longer-term, batteries could support very high levels of variable renewable electricity, specifically by storing surplus energy and releasing it later, when the sun is not shining or the wind not blowing strongly enough. While pumped-hydro systems still dominate electricity storage (with 96% of installed storage capacity in mid-2017), battery systems for stationary applications have started growing rapidly. Wider deployment and the commercialisation of new battery storage technologies has led to rapid cost reductions, notably for lithium-ion batteries, but also for high-temperature sodium-sulphur (“NAS”) and so-called “flow” batteries. In Germany, for example, small-scale household Li-ion battery costs have fallen by over 60% since late 2014. Steadily improving economic viability has, in turn, opened up new applications for battery storage. Like solar photovoltaic (PV) panels a decade earlier, battery electricity storage systems offer enormous deployment and cost-reduction potential, according to this study by the International Renewable Energy Agency (IRENA). By 2030, total installed costs could fall between 50% and 60% (and battery cell costs by even more), driven by optimisation of manufacturing facilities, combined with better combinations and reduced use of materials. Battery lifetimes and performance will also keep improving, helping to reduce the cost of services delivered. Lithium-ion battery costs for stationary applications could fall to below USD 200 per kilowatt-hour by 2030 for installed systems. Battery storage in stationary applications looks set to grow from only 2 gigawatts (GW) worldwide in 2017 to around 175 GW, rivalling pumped-hydro storage, projected to reach 235 GW in 2030. In the meantime, lower installed costs, longer lifetimes, increased numbers of cycles and improved performance will further drive down the cost of stored electricity services. IRENA has developed a spreadsheet-based “Electricity Storage Cost-of-Service Tool” available for download. It is a simple tool that allows a quick analysis of the approximate annual cost of electricity storage service for different technologies in different applications. It is not a detailed simulation for investment decisions, but allows those interested in specific applications to identify some of the potentially more cost-effective options available. These could then be subject to more detailed analysis of their suitability for the specific application, their performance in given the real-world operating conditions of the application and their relative economics. World Energy Outlook 2017
Global shifts in the energy system Four large-scale shifts in the global energy system set the scene for the World Energy Outlook 2017: the rapid deployment and falling costs of clean energy technologies, the growing electrification of energy, the shift to a more services-oriented economy and a cleaner energy mix in China, and the resilience of shale gas and tight oil in the United States. These shifts come at a time when traditional distinctions between energy producers and consumers are being blurred and a new group of major developing countries, led by India, moves towards centre stage. How these developments play out and interact is the story of this year’s Outlook. Growing energy demandIn the New Policies Scenario, global energy needs rise more slowly than in the past but still expand by 30% between today and 2040. This is the equivalent of adding another China and India to today’s global demand. A global economy growing at an average rate of 3.4% per year, a population that expands from 7.4 billion today to more than 9 billion in 2040, and a process of urbanisation that adds a city the size of Shanghai to the world’s urban population every four months are key forces that underpin our projections. The largest contribution to demand growth – almost 30% – comes from India, whose share of global energy use rises to 11% by 2040 (still well below its 18% share in the anticipated global population). Southeast Asia is another rising heavyweight in global energy, with demand growing at twice the pace of China. Overall, developing countries in Asia account for two-thirds of global energy growth, with the rest coming mainly from the Middle East, Africa and Latin America. Renewables step up, coal strikes out Compared with the past twenty-five years, the way that the world meets its growing energy needs changes dramatically in the New Policies Scenario, with the lead now taken by natural gas, by the rapid rise of renewables and by energy efficiency. Improvements in efficiency play a huge role in taking the strain off the supply side: without them, the projected rise in final energy use would more than double. Renewable sources of energy meet 40% of the increase in primary demand and their explosive growth in the power sector marks the end of the boom years for coal. Since 2000, coal-fired power generation capacity has grown by nearly 900 gigawatts (GW), but net additions from today to 2040 are only 400 GW and many of these are plants already under construction. In India, the share of coal in the power mix drops from three-quarters in 2016 to less than half in 2040. In the absence of large-scale carbon capture and storage, global coal consumption flatlines. Oil demand continues to grow to 2040, albeit at a steadily decreasing pace. Natural gas use rises by 45% to 2040; with more limited room to expand in the power sector, industrial demand becomes the largest area for growth. The outlook for nuclear power has dimmed since last year’s Outlook, but China continues to lead a gradual rise in output, overtaking the United States by 2030 to become the largest producer of nuclear-based electricity. Bright future for renewablesRenewables capture two-thirds of global investment in power plants to 2040 as they become, for many countries, the least-cost source of new generation. Rapid deployment of solar photovoltaics (PV), led by China and India, helps solar become the largest source of low-carbon capacity by 2040, by which time the share of all renewables in total power generation reaches 40%. In the European Union, renewables account for 80% of new capacity and wind power becomes the leading source of electricity soon after 2030, due to strong growth both onshore and offshore. Policies continue to support renewable electricity worldwide, increasingly through competitive auctions rather than feed-in tariffs, and the transformation of the power sector is amplified by millions of households, communities and businesses investing directly in distributed solar PV. Growth in renewables is not confined to the power sector. The direct use of renewables to provide heat and mobility worldwide also doubles, albeit from a low base. In Brazil, the share of direct and indirect renewable use in final energy consumption rises from 39% today to 45% in 2040, compared with a global progression from 9% to 16% over the same period. The future is electrifyingElectricity is the rising force among worldwide end-uses of energy, making up 40% of the rise in final consumption to 2040 – the same share of growth that oil took for the last twenty-five years. Industrial electric motor systems account for one-third of the increase in power demand in the New Policies Scenario. Rising incomes mean that many millions of households add electrical appliances (with an increasing share of “smart” connected devices) and install cooling systems. Electricity makes inroads in supplying heat and mobility, alongside growth in its traditional domains, allowing its share of final consumption to rise to nearly a quarter. A strengthening tide of industry initiatives and policy support pushes our projection for the global electric car fleet up to 280 million by 2040, from 2 million today. The scale of future electricity needs and the challenge of decarbonising power supply help to explain why global investment in electricity overtook that of oil and gas for the first time in 2016 and why electricity security is moving firmly up the policy agenda. The increasing use of digital technologies across the economy improves efficiency and facilitates the flexible operation of power systems, but also creates potential new vulnerabilities that need to be addressed. When China changes, everything changesChina is entering a new phase in its development. The president’s call for an “energy revolution”, the “fight against pollution” and the transition towards a more services-based economic model is moving the energy sector in a new direction - with the emphasis in energy policy now firmly on electricity, natural gas and cleaner, high-efficiency and digital technologies. Demand growth slowed markedly from an average of 8% per year from 2000 to 2012 to less than 2% per year since 2012, and in the New Policies Scenario it slows further to an average of 1% per year to 2040. Energy efficiency regulation explains a large part of this slowdown. Without new efficiency measures, end-use consumption in 2040 would be 40% higher. Nonetheless, by 2040 per-capita energy consumption in China exceeds that of the European Union. China’s choices will play a huge role in determining global trends, and could spark a faster clean energy transition. The scale of China’s clean energy deployment, technology exports and outward investment makes it a key determinant of momentum behind the low-carbon transition: one-third of the world’s new wind power and solar PV is installed in China in the New Policies Scenario, and China also accounts for more than 40% of global investment in electric vehicles (EVs). China provides a quarter of the projected rise in global gas demand and its projected imports of 280 billion cubic metres (bcm) in 2040 are second only to those of the European Union, making China a linchpin of global gas trade. China overtakes the United States as the largest oil consumer around 2030, and its net imports reach 13 million barrels per day (mb/d) in 2040. But stringent fuel-efficiency measures for cars and trucks, and a shift which sees one-in-four cars being electric by 2040, means that China is no longer the main driving force behind global oil use – demand growth is larger in India post-2025. China remains a towering presence in coal markets, but our projections suggest that coal use peaked in 2013 and is set to decline by almost 15% over the period to 2040. The US shale revolution turns to exportsA remarkable ability to unlock new resources cost-effectively pushes combined United States oil and gas output to a level 50% higher than any other country has ever managed; already a net exporter of gas, the US becomes a net exporter of oil in the late 2020s. In our projections, the 8 mb/d rise in US tight oil output from 2010 to 2025 would match the highest sustained period of oil output growth by a single country in the history of oil markets. A 630 bcm increase in US shale gas production over the 15 years from 2008 would comfortably exceed the previous record for gas. Expansion on this scale is having wide-ranging impacts within North America, fuelling major investments in petrochemicals and other energy-intensive industries. It is also reordering international trade flows and challenging incumbent suppliers and business models. By the mid-2020s, the United States become the world’s largest liquefied natural gas (LNG) exporter and a few years later a net exporter of oil – still a major importer of heavier crudes that suit the configuration of its refineries, but a larger exporter of light crude and refined products. The era of oil is not yet overWith the United States accounting for 80% of the increase in global oil supply to 2025 and maintaining near-term downward pressure on prices, the world’s consumers are not yet ready to say goodbye to the era of oil. Up until the mid-2020s demand growth remains robust in the New Policies Scenario, but slows markedly thereafter as greater efficiency and fuel switching bring down oil use for passenger vehicles (even though the global car fleet doubles from today to reach 2 billion by 2040). Powerful impetus from other sectors is enough to keep oil demand on a rising trajectory to 105 mb/d by 2040: oil use to produce petrochemicals is the largest source of growth, closely followed by rising consumption for trucks (fuel-efficiency policies cover 80% of global car sales today, but only 50% of global truck sales), for aviation and for shipping. Once US tight oil plateaus in the late 2020s and non-OPEC production as a whole falls back, the market becomes increasingly reliant on the Middle East to balance the market. There is a continued large-scale need for investment to develop a total of 670 billion barrels of new resources to 2040, mostly to make up for declines at existing fields rather than to meet the increase in demand. Even greater upside for US tight oil and a more rapid switch to electric cars would keep oil prices lower for longer. We explore this possibility in a Low Oil Price Case, in which a doubling of the estimate for tight oil resources, to more than 200 billion barrels, boosts US supply and more widespread application of digital technologies helps to keep a lid on upstream costs around the globe. Extra policy and infrastructure support pushes a much more rapid expansion in the global electric car fleet, which approaches 900 million cars by 2040. Along with a favourable assumption about the ability of the main oil-producing regions to weather the storm of lower hydrocarbon revenues, this is enough to keep prices within a $50-70/barrel range to 2040. However, it is not sufficient to trigger a major turnaround in global oil use. Even with a rapid transformation of the passenger car fleet, reaching a peak in global demand would require stronger policy action in other sectors. Otherwise, in a lower oil price world, consumers have few economic incentives to make the switch away from oil or to use it more efficiently. Meanwhile, with projected demand growth appearing robust, at least for the near term, a third straight year in 2017 of low investment in new conventional projects remains a worrying indicator for the future market balance, creating a substantial risk of a shortfall of new supply in the 2020s. A new order for global gas marketsNatural gas grows to account for a quarter of global energy demand in the New Policies Scenario by 2040, becoming the second-largest fuel in the global mix after oil. In resource-rich regions, such as the Middle East, the case for expanding gas use is relatively straightforward, especially when it can substitute for oil. In the United States, plentiful supplies maintain a strong share of gas-fired power in electricity generation through to 2040, even without national policies limiting the use of coal. But 80% of the projected growth in gas demand takes place in developing economies, led by China, India and other countries in Asia, where much of the gas needs to be imported (and so transportation costs are significant) and infrastructure is often not yet in place. This reflects the fact that gas looks a good fit for policy priorities in this region, generating heat, power and mobility with fewer carbon-dioxide (CO2) and pollutant emissions than other fossil fuels, helping to address widespread concerns over air quality. But the competitive landscape is formidable, not just due to coal but also to renewables, which in some countries become a cheaper form of new power generation than gas by the mid-2020s, pushing gas-fired plants towards a balancing rather than a baseload role. Efficiency policies also play a part in constraining gas use: while the electricity generated from gas grows by more than half to 2040, related gas use rises by only one-third, due to more reliance on highly efficient plants. A new gas order is emerging, with US LNG helping to accelerate a shift towards a more flexible, liquid, global market. Ensuring that gas remains affordable and secure, beyond the current period of ample supply and lower prices, is critical for its long-term prospects. LNG accounts for almost 90% of the projected growth in long-distance gas trade to 2040: with few exceptions, most notably the route that opens up between Russia and China, major new pipelines struggle in a world that prizes the optionality of LNG. Gas supply also becomes more diverse: the amount of liquefaction sites worldwide doubles to 2040, with the main additions coming from the United States and Australia, followed by Russia, Qatar, Mozambique and Canada. Price formation is based increasingly on competition between various sources of gas, rather than indexation to oil. With destination flexibility, hub-based pricing and spot availability, US LNG acts as a catalyst for many of the anticipated changes in the wider gas market. The new gas order can bring dividends for gas security, although there is the risk of a hard landing for gas markets in the 2020s if uncertainty over the pace or direction of change deters new investments. Over the longer term, a larger and more liquid LNG market can compensate for reduced flexibility elsewhere in the energy system (for example, lower fuel-switching capacity in some countries as coal-fired generation is retired). We estimate that, in 2040, it would take around ten days for major importing regions to raise their import levels by 10%, a week less than it might take today in Europe, Japan and Korea. Falling short on access, air pollution and GHGsAccess to electricity and clean cookingUniversal access to electricity remains elusive, and scaling up access to clean cooking facilities is even more challenging. There are some positive signs: over 100 million people per year have gained access to electricity since 2012 compared with around 60 million per year from 2000 to 2012. Progress in India and Indonesia has been particularly impressive, and in sub-Saharan Africa electrification efforts outpaced population growth for the first time in 2014. People without access to electricityPeople without cleancooking accessBillion peoplePeople without access to electricity and clean cooking facilitiesSub-Saharan AfricaIndiaSoutheast AsiaOther Developing AsiaChinaOther developing economies200020042008201220162000201500.511.522.53World Energy Outlook 2017, IEABut, despite this momentum, in the New Policies Scenario around 675 million people – 90% of them in sub-Saharan Africa – remain without access to electricity in 2030 (down from 1.1 billion today), and 2.3 billion continue to rely on biomass, coal or kerosene for cooking (from 2.8 billion today). Household air pollution from these sources is currently linked to 2.8 million premature deaths per year, and several billion hours are spent collecting firewood for cooking, mostly by women, that could be put to more productive uses. Air qualityPolicy attention to air quality is rising and global emissions of all the major pollutants fall in our projections, but their health impacts remain severe. Ageing populations in many industrialised societies become more vulnerable to the effects of air pollution and urbanisation can also increase exposure to pollutants from traffic. Premature deaths worldwide from outdoor air pollution rise from 3 million today to more than 4 million in 2040 in the New Policies Scenario, even though pollution control technologies are applied more widely and other emissions are avoided because energy services are provided more efficiently or (as with wind and solar) without fuel combustion. GHG emissionsDespite their recent flattening, global energy-related CO2 emissions increase slightly to 2040 in the New Policies Scenario. This outcome is far from enough to avoid severe impacts of climate change, but there are a few positive signs. Projected 2040 emissions in the New Policies Scenario are lower by 600 million tonnes than in last year’s Outlook (35.7 gigatonnes [Gt] versus 36.3 Gt). In China, CO2 emissions are projected to plateau at 9.2 Gt (only slightly above current levels) by 2030 before starting to fall back. Worldwide emissions from the power sector are limited to a 5% increase between now and 2040, even though electricity demand grows by 60% and global GDP by 125%. However, the speed of change in the power sector is not matched elsewhere: CO2emissions from oil use in transport almost catch up with those from coal-fired power plants (which are flat) by 2040, and there is also a 20% rise in emissions from industry. The Sustainable Development ScenarioThe Sustainable Development Scenario offers an integrated way to achieve a range of energy-related goals crucial for sustainable economic development: climate stabilisation, cleaner air and universal access to modern energy, while also reducing energy security risks. This scenario starts from a set of desired outcomes and considers what would be necessary to deliver them. Central to these outcomes is the achievement of an early peak in CO2 emissions and a subsequent rapid decline, consistent with the Paris Agreement. A key finding is that universal access to electricity and clean cooking can be reached without making this task any more challenging. We also investigate, in a Faster Transition Scenario, how policies could push an even more rapid and steeper decline in CO2 emissions and limit climate risks further. In the Sustainable Development Scenario, low-carbon sources double their share in the energy mix to 40% in 2040, all avenues to improve efficiency are pursued, coal demand goes into an immediate decline and oil consumption peaks soon thereafter. Power generation is all but decarbonised, relying by 2040 on generation from renewables (over 60%), nuclear power (15%) as well as a contribution from carbon capture and storage (6%) – a technology that plays an equally significant role in cutting emissions from the industry sector. Electric cars move into the mainstream quickly, but decarbonising the transport sector also requires much more stringent efficiency measures across the board, notably for road freight. The sustainable development scenarioRelative to other recent decarbonisation scenarios20402100Emissions from scenarios projecting global temperature rise of around 1.7-1.8°C:20002010202020302040205020602070208020902100-30-20-10010203040World Energy Outlook 2017, IEA Gt CO2The 2030 targets for renewables and efficiency that are defined in the Sustainable Development agenda are met or exceeded in this scenario; renewables and efficiency are the key mechanisms to drive forward the low-carbon transition and reduce pollutant emissions. Considering the inter-linkages between them and aligning policy and market frameworks – notably in the residential sector – is essential to ensure cost-efficient outcomes. The provision of highly efficient appliances, combined with decentralised renewables, also play a major role in extending full access to electricity and clean cooking, especially in rural communities and isolated settlements that are hard to reach with the grid. Natural gas and the clean energy transitionsAs oil and coal fall back and renewables ramp up strongly, natural gas becomes the largest single fuel in the global mix in the Sustainable Development Scenario. Securing clear climate benefits from gas use depends on credible action to minimise leaks of methane – a potent greenhouse gas – to the atmosphere. Consumption of natural gas rises by nearly 20% to 2030 in the Sustainable Development Scenario and remains broadly at this level to 2040. The contribution of gas varies widely across regions, between sectors and over time in this scenario. In energy systems heavily reliant on coal (as in China and India), where renewable alternatives are less readily available (notably in some industrial sectors), or where seasonal flexibility is required to integrate high shares of variable renewables, gas plays an important role. Stepping up action to tackle methane leaks along the oil and gas value chain is essential to bolster the environmental case for gas: these emissions are not the only anthropogenic emissions of methane, but they are likely to be among the cheapest to abate. We present the first global analysis of the costs of abating the estimated 76 million tonnes of methane emitted worldwide each year in oil and gas operations, which suggest that 40-50% of these emissions can be mitigated at no net cost, because the value of the captured methane could cover the abatement measures. Implementing these measures in the New Policies Scenario would have the same impact on reducing the average global surface temperature rise in 2100 as shutting all existing coal-fired power plants in China. Exxon, Shell, BP Join Forces to Cut Emissions From Natural Gas
Exxon Mobil Corp. plans to join with other big energy companies in an effort to reduce pollution from natural gas production, according to people familiar with the matter. The new grouping will also include Royal Dutch Shell PLC and BP PLC, according to the people. While Shell and BP have joined forces with other global players in the past in similar industrywide collaborations on environmental issues, Exxon has more typically stayed on the sidelines. The group plans to endorse and push principles to help reduce methane emissions from natural gas production, transportation and consumption, according to the people. The firms plan to announce the new effort later Wednesday. In recent months, Exxon has become more engaged with issues related to climate change, after pressure from investors and legal challenges. The company has increased its climate-related disclosures, stated its commitment to the Paris climate agreement, named an environmental expert to its board and worked to reduce emissions from its operations. But it has also resisted shareholder requests for more information about how climate change will affect its operations. It has also mostly stayed out of a handful of climate-change collaborations led by its European peers--until now. Previous industry efforts have often had a broad scope that included ways to cut carbon emissions. The new effort is targeting methane, another so-called greenhouse gas that is the main component of natural gas. When natural gas is burned, it releases less carbon dioxide than oil or coal. But unburnt methane can also escape into the atmosphere during the production process, for example, from leaky pipes. A recent International Energy Agency study found around 76 million tons of methane are emitted every year from global oil and gas operations. That is equivalent to more than Australia's entire natural gas output, the IEA Executive Director Fatih Birol told an industry gathering last month. LONDON -- Exxon Mobil Corp. has joined with seven other big energy companies to reduce pollution from natural gas production, an effort by the industry to present itself as part of the solution as governments and consumers demand more environmentally friendly energy. Big oil companies like Exxon and Royal Dutch Shell PLC have increasingly touted natural gas as a core tool to combat climate change, since it is produces fewer greenhouse gas emissions than the fuel it often replaces in electricity production, coal. The rare trans-Atlantic alignment was first reported by The Wall Street Journal, ahead of the companies' announcement Wednesday. The collaboration by companies including Exxon, Shell, BP PLC and Total SA, shows the oil and gas sector is proactively trying to address burgeoning concerns about natural gas emissions to ensure that its big bet on the fossil fuel pays off. Major energy companies have made big investments in gas in recent years and are steadily growing their production volumes. They argue that it will prove a vital source of energy stability even as renewables increase their market share, since gas can be burned when the sun isn't shining or the wind isn't blowing. But methane, the main component in natural gas, is also a potent greenhouse gas and the issue of fugitive emissions that occur when it leaks into the atmosphere is starting to draw negative attention. Exxon and its partners said Wednesday that they have signed up to a set of guiding principles, committing to drive down methane emissions from their assets, encourage better performance from their peers, improve transparency and data accuracy on the matter and advocate for better regulation. "The commitment was made as part of wider efforts by the global energy industry to ensure that natural gas continues to play a critical role in helping meet future energy," the companies said in a joint statement. "Its role in the transition to a low-carbon future will be influenced by the extent to which methane emissions are reduced." A recent International Energy Agency study found around 76 million tons of methane are emitted every year from global oil and gas operations. That is the equivalent to more than Australia's entire natural gas production, the IEA's executive director, Fatih Birol told an industry gathering last month. The companies set of principles was developed in collaboration with the IEA, the United Nations and other international organizations focused on energy and climate change. Exxon's decision to join the group leaves Chevron Corp. as the only major U.S. oil company that has yet to join the initiative. Both the U.S. oil companies have lagged behind their European peers on the issue of climate and Exxon hasn't participated in previous similar efforts to build an industry voice on such subjects. Over the years, activists have pointed to the lack of participation by Exxon and Chevron in the group climate effort as evidence of a divide between the biggest U.S. and European oil companies on the issue. Still, under pressure from investors over the last year, they have both undergone an evolution in the way they address climate change publicly. Chevron has made strides in its own methane reduction efforts and provided more information about how it is looking at climate risks. The company didn't immediately respond to a request for comment. Exxon Chief Executive Darren Woods has urged President Donald Trump not to withdraw from the Paris climate accord. The company has also initiated research efforts to test the viability of capturing emissions from natural gas power plant operations, as well as continued to study ways to convert algae into fuel. 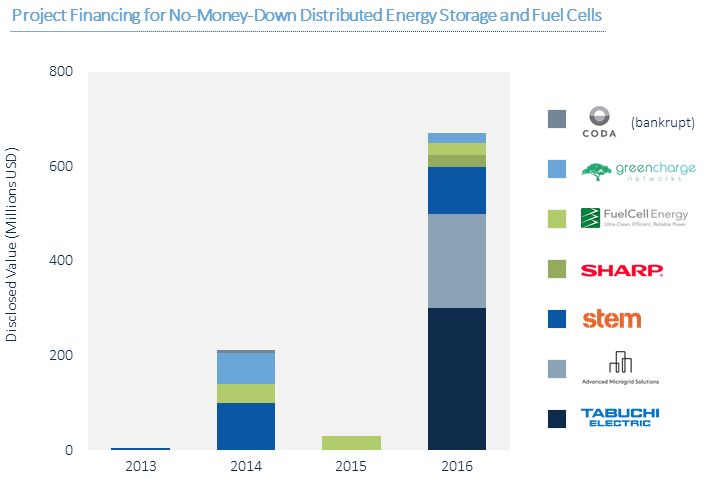 Energy Storage Financing
Energy storage vendors face a challenge familiar to other purveyors of capital-intensive products: Most customers can't pay cash. The key to reaching mainstream audiences, then, is to offer financing at a reasonable rate along with the product. Such programs have long been available for cars and houses. They have become mainstream for rooftop solar installations, thanks to services like Mosaic that offer zero-money-down financing online in a matter of minutes. Until very recently, storage didn't have a similar service to offer. That's starting to change. This summer, Advanced Microgrid Solutions and Stemraised big new money for storage project financing -- $200 million and $100 million, respectively. In September, both Tabuchi Electric and Sharp announced new funding specifically for financing solar-plus-storage systems. VC funding for no-money-down distributed storage financing is approaching $700 million for this year, more than triple the last major wave of funding, which occurred in 2014. The new programs alone won't take storage mainstream, but if they demonstrate success, they could inspire additional monied institutions to get into the game, and that would have major consequences for the modernization of the grid. Banks or other tax equity investors want to get a return on their investments, and that means offering loans to projects they feel sure will pay them back. That caution held back investments in solar projects in the early days, but now solar providers have a lot of data to call upon: They can tell the bank how much sunlight a particular site gets in a year and how much power they can expect to produce there. Advanced energy storage, on the other hand, is still making a name for itself. "There’s no track record of five or more years of real returns out of these systems," said Carl Mansfield, general manager and founder of Sharp’s energy storage division. "Bankability for storage is still a challenge." The same applies to storage companies, according to GTM Research energy storage analyst Brett Simon. "Battery storage is a relatively young technology and a significant number of storage companies have only been around for a few years, and may not be around for the length of the system warranty," he said. The complex hybrid nature of solar-plus-storage, which Sharp specializes in, made third-party financiers uneasy. That left potential customers facing high upfront costs and needing drastic measures to afford the storage component. The main possibility, Mansfield said, was collateralization of assets, like taking out a loan on a building. That's highly risky. "It’s clear that financing is essential to enable a market to grow," Mansfield said. "Just as with PV, people would find ways to finance it by themselves, but it was really once the turnkey, readily available PPA financing and lease financing appeared that the market really took off." Now Sharp has a pilot program of $25 million from an unnamed third-party financier to lend to its customers. A single contract covers the whole solar-plus-storage system and comes with a 10-year asset management service agreement and demand-reduction performance guarantee; by ensuring the customer gets value from the project, Sharp can assure the lender that the money will be paid back. The immediate impact will be a drastic expansion of the customer base. "We have a pretty significant pipeline of commercial and industrial customers, but we find that more than 90 percent of those customers need some kind of arranged financing," Mansfield said. Now they can get it. Additionally, the knowledge that this financing is available and costs nothing upfront could speed up the sales cycle. Sharp's project lead times are long even if the storage will save the customers money, Mansfield said. It's a structural challenge: When a company has extra capital to spend, it will usually use that money to grow in size or revenue. A solar-plus-storage system doesn't add any new business capability, it just saves on operating expenses. A hybrid storage system that costs the customer nothing and saves money on the next utility bill, then, makes for a much more enticing offer. Tabuchi is finding that to be true, as well. The American arm of the Japanese inverter company received $300 million from GeoSmart SolPower to offer no-money-down loans in 17 states, ranging from 10 years at 1.99 percent to 20 years at 4.99 percent. (There's also a much smaller leasing program.) The solar-plus-storage product includes a 5.5-kilowatt solar inverter with a bidirectional DC-to-DC battery power converter and a 10-kilowatt-hour Panasonic lithium-ion battery pack managed by Geli software. "It was obvious something needed to happen," said Daniel Hill, Tabuchi America's sales and marketing director. "Without it, we were missing a big chunk of the market, as well as a very powerful sales tool." In arranging the financing, Hill said it helped that his company had a long track record. Tabuchi has been operating in Japan for 90 years, making inverters for 20, and has sold "many thousands" of storage systems in Japan. It was an established player, bringing an established product to American consumers. Most storage companies lack that kind of history. They may need to bank on early adopters paying cash for a few more years until they've built up the kind of track record banks want to see. By then, if these early loan programs have proven themselves secure and reliable, a loan program might be a lot easier to pitch. Battery Storage for Renewables: Market Status and Technology Outlook
Energy Storage Case Studies Renewable Energy Case Studies Energy storage capabilities are crucial for the integration of high levels variable renewable sources, such as solar and wind energy, onto the power grid. This report shows that battery storage technologies for renewable energy are already cost-competitive for island and rural applications. Furthermore, the market for battery storage systems coupled with rooftop solar panels has started growing rapidly. The report is accompanied by 12 case studies on battery storage systems around the world |
